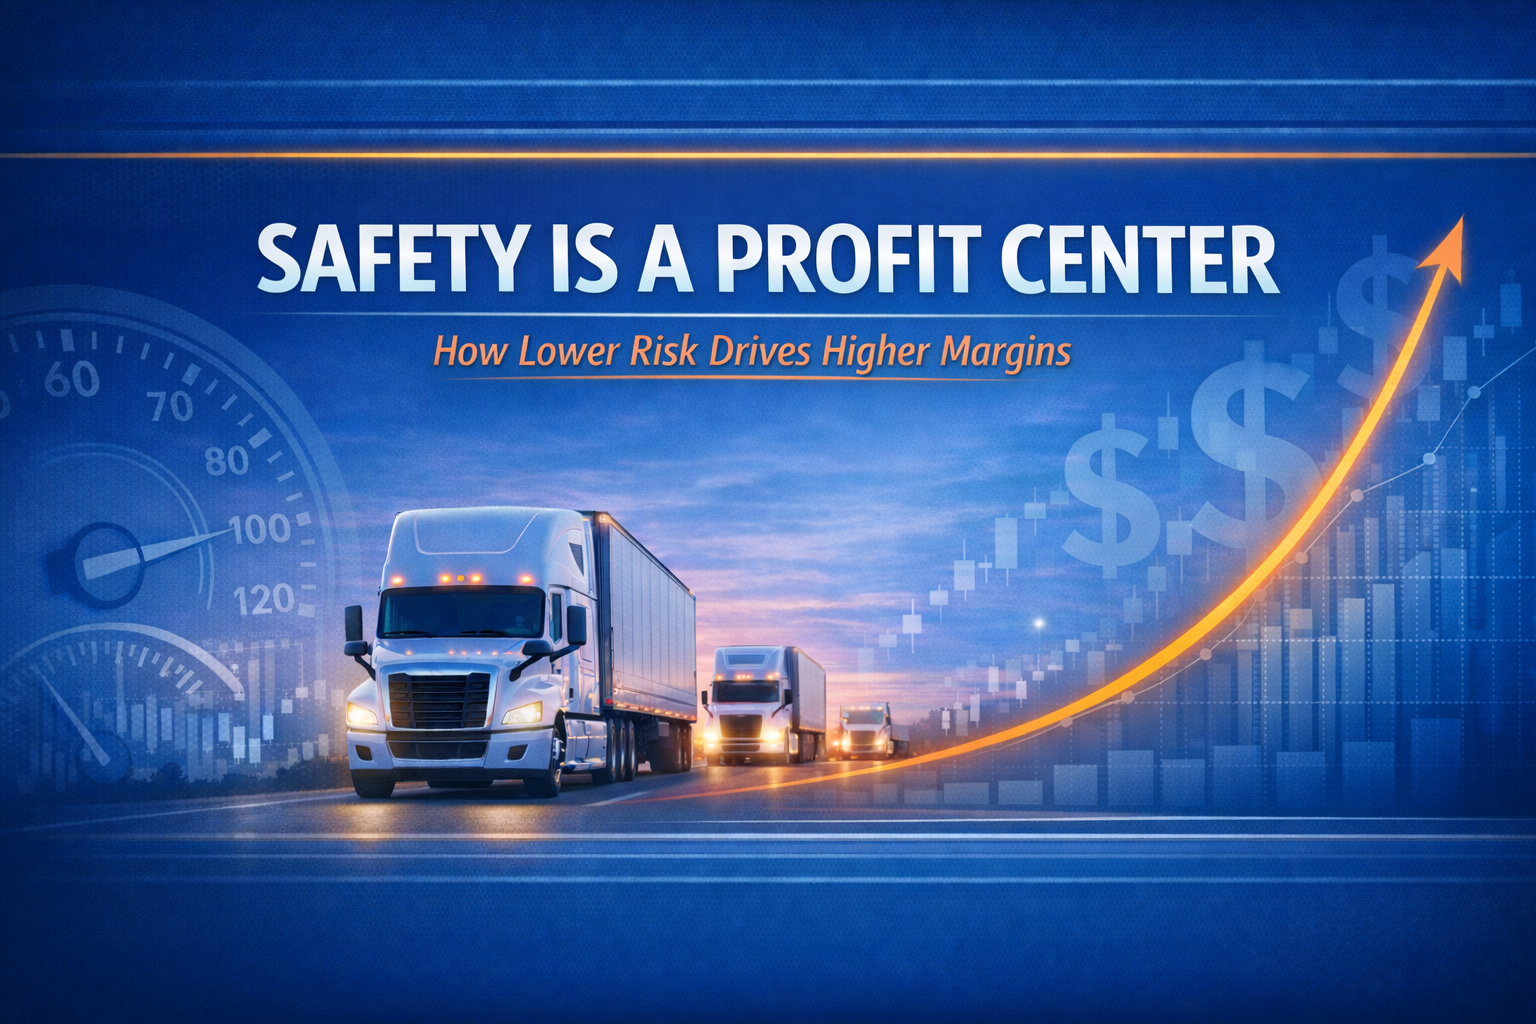
How to Make Safety Your Newest Profit Center
How does one quantify the cost of an adverse event that never happens? This is the paradox of safety. Steps are taken today to prevent something from happening tomorrow. If those steps are successful, nothing happens.
What is the value of “nothing”? One practical approach is to consider the cost if something did happen and work backwards from there. The numbers are much more compelling than most people expect.
Insurance
Accidents increase insurance premiums. That part is well understood. What is less obvious is the multiplier effect that losses have on future premiums.
The mechanics of quoting and rating a policy can be complex and involve adjustments for things like historical claims experience, inflation, limits offered, loss development, and other factors. So, for most people, the way in which their insurer determines their premium is essentially a “black box” process. However, a simple approach can provide a reasonable estimate of the impact of losses on premium.
Certainly, insurers seek to charge enough premium to cover expected losses. In addition, like all businesses, insurance companies have operating expenses. These generally amount to roughly 30% of the insurer’s premium revenue. Insurance companies also seek to make a profit.
So, for every $1 of expected loss, an insurer seeking to make a 10% profit needs $1.67 of premium ($1 / (1 – 30% for expenses – 10% for profit)). Looking at this in another way, every $1 of loss costs you $1.67 of insurance premium.
A $50,000 claim that your safety program prevents is not just a $50,000 savings. It represents roughly $83,500 in premium expense savings.
Adding to this, insurers look at loss history spanning multiple years. As a result, increased premium costs are not a “one and done.” Instead, costs remain elevated for years after the original loss.
The Cost of Speed
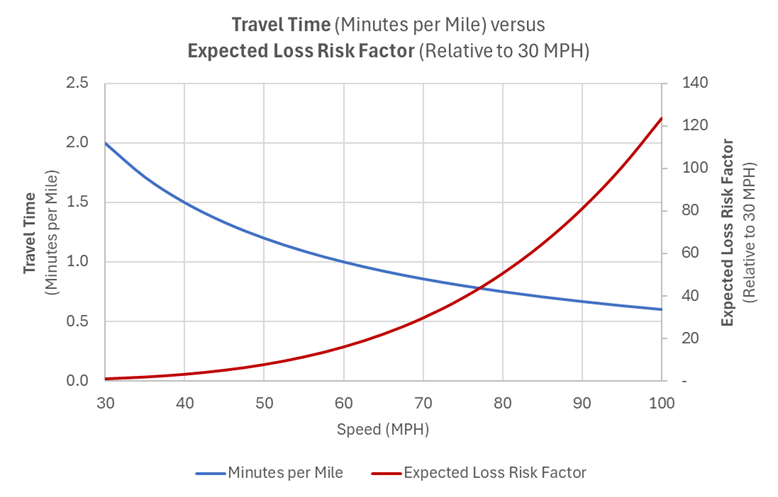
Insurance costs are one way to quantify the value of your safety efforts. The cost of speed offers another helpful perspective. The risk of a loss happening (Frequency) and the size of a loss (Severity) each increase exponentially with speed (Velocity).1
Total expected loss is equal to Frequency times Severity. With each of these factors being an exponential function of Velocity, total loss is a function of V² times V², or Velocity to the 4th power. So, as one increases speed, cost increases at a rate of V⁴.
The prime benefit of increased speed would seem to be time saved. However, there is a limit to the benefit of speeding (total trip time can never be less than zero). So, the relative amount of time saved actually diminishes with each additional MPH. On the other hand, there is virtually no limit to the amount of risk that can be incurred as speed increases, and risk actually balloons at the rate of speed to the fourth power.
For the math fans in the audience, here are a few numbers that demonstrate the increasing cost and diminishing return of speed:
As speed increases, expected loss increases dramatically, but improvements in trip time are progressively smaller.2 Graphically, the relationship looks something like this:
Saving Money at the Pump
While the costs of loss offer one way to consider the value of safety, there are more traditional economic factors to consider as well. One of these is the charges that hit your fuel cards every month. There are a number of studies on the impact of speed on miles per gallon. Two of these can be summarized as follows for every 10-mph reduction over 55 mph (e.g., 70 to 60):
So, safer driving results in immediate fuel cost savings.
Overlooked Costs of Unsafe Driving
Gaps in safety can add other costs that are often overlooked:
- Fines – DOT penalties, moving violations, and CSA point accumulation carry direct costs and can trigger increased regulatory scrutiny.
- Accelerated vehicle maintenance – Higher sustained speeds increase wear on brakes, tires, and drivetrain components, shortening replacement cycles and adding unplanned maintenance costs.
- Workers Compensation claims – A vehicle accident that injuries a driver opens a separate and often expensive claims track that runs parallel to the auto claim.
- Vehicles taken off the road – Every unit in the shop is a unit not generating revenue.
- Time lost on handling claims – Internal staff time managing adjusters, gathering documentation, and coordinating repairs is real overhead.
- Deductible costs – Pure out of pocket expenses that come straight off the bottom line.
- Employee time out of work – An injured employee is not just a workers’ comp claim. That person’s position needs to be covered while that person recovers.
Safety Is a Profit Center
Net, net: greater safety equals greater profit. Lower insurance costs, lower fuel bills, reduced maintenance expense, fewer fines, less downtime, and fewer claims to manage. These cost reductions compound over time as safety improves.
Creating and driving a safety culture protects not only the health and welfare of your employees, your business, and your reputation – it also protects your bottom line. And increasingly, the data from telematics and coaching programs gives fleet operators and their insurance partners the tools to measure what is working and make adjustments that drive real improvements.
Safety is not a cost center. It is a profit center.
- An easy way to understand the frequency impact of speed is to consider braking distance for an 80,000 lb. vehicle with well-functioning brakes on dry pavement. At 60 mph, the vehicle has a braking distance of 500 feet. At 80 mph, it takes 889 feet to stop. While speed increased 33%, braking distance increased by 78% (1.33² = 1.78). Severity can be considered through the lens of kinetic energy (KE = ½ Mass × Velocity²).
- 70 mph – 60 mph = 10 mph. 10 mph ÷ 60 mph = 17%. 1.17⁴ = 1.85, or 85% increase in expected loss. 60 miles ÷ 70 mph = 0.86, or 14% trip time savings.
- U.S. Department of Energy / EPA.
- NESCCAF/ICCT, “Reducing Heavy-Duty Long Haul Combination Truck Fuel Consumption and CO₂ Emissions.” Also see ICCT, “Real-World Fuel Consumption of Heavy-Duty Vehicles in the United States, Europe, and China,” 2015.